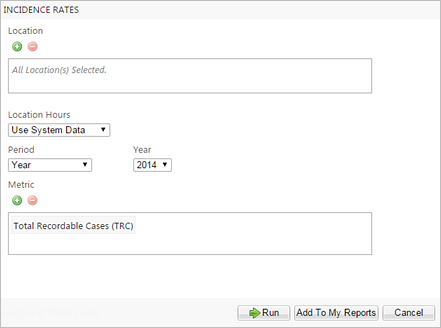
Incidence Rates
You can use this report to calculate the incident rate at your location and compare your rate to other organizations within your industry and to your organization's internal goals. You can also identify trends in your incident rates over the course of months and years.
The Incidence Rate trend graphs display for each location allowing you to easily identify trends and cycles if multiple locations are selected. The incidence rate tables for each location will display on separate pages after the trend graphs.
Additional fields display when you save the report as data. You can see more information about the factors involved in the incidence rate calculation.
Report Parameters
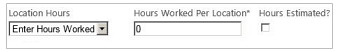
Additional fields display when selecting Enter Hours Worked from the Location Hours field. The additional fields are shown in the image below.
| Parameter | Default Value | Details |
|---|---|---|
|
Injury Location |
None selected |
All locations are included by default. |
|
Location Hours |
Use System Data |
Selecting Use System Data pulls the hours worked from the Location record. Note: Yearly hours worked totals are automatically calculated based on
each location's monthly totals. The hours worked total is
considered estimated if any of the monthly totals are marked Is
Estimated.
The Hours Worked and Hours Estimated parameters will not display unless you select Enter Hours Worked from the Source Hours Worked drop-down. |
|
Hours Worked Per Location |
0 |
Select the checkbox if the hours entered are estimated. |
|
Hours |
Blank |
This option is available only if you select Enter Hours Worked in the Location Hours parameter. Enter the total hours worked. |
|
Hours Estimated? |
Unchecked |
This option is available only if you select Enter Hours Worked in the Location Hours parameter. |
|
Period |
Year |
Yearly hours worked totals are calculated when running the report and update the yearly total on the location record. |
|
Metric |
Total Recordable Cases |
|
Calculations for Incident Rates
The column(s) in the calculations below refer to the corresponding column(s) on the OSHA 300 report.
The Total Hours Worked in the calculation refers to metric entered in the Hours field on the Incident Rates parameters screen.
| Metric | Calculation | OSHA 300 Column Name |
|---|---|---|
|
Nonfatal Total Recordable Case (NF-TRC) Rate |
Number of non-fatal injuries and illnesses X standard factor / Total Hours Worked 1, 666, 666 is used when calculating individual illness rates for a year. |
|
|
Days Away from Work, Job Transfer, or Restriction Cases Rate (DART) |
(Column H + Column I) X standard factor / Total Hours Worked |
|
|
Days Away from Work Cases Rate (DAFW) |
(Column H X standard factor) / Total Hours Worked This rate calculates the number of cases with lost work days. |
Days away from work |
|
Lost Workday Severity Rate |
(Number of lost days on injury records X standard factor) / Total Hours Worked
This rate calculates the number of lost days in case records. Injury records with a date of death are not included in this rate. Only LWDs are included when an injury record contains both LWDs and RWDs. |
Days away from work |
|
Days of Job Transfer or Restriction Cases Rate (DJTR) |
(Column I X standard factor) / Total Hours Worked |
Job transfer or restriction |
|
Other Recordable Cases Rate (ORC) |
(Column J X standard factor) / Total Hours Worked |
Other recordable cases |
|
Total Recordable Incident Rate (TRIR) |
(Column G + Column H + Column I + Column J X standard factor) / Total Hours Worked |
|
|
Injury Only Cases Rate |
(Column M1 X standard factor) / Total Hours Worked |
Injury |
|
Skin Disorder Cases Rate |
(Column M2 X standard factor) / Total Hours Worked |
Skin Disorder |
|
Respiratory Condition Cases Rate |
(Column M3 X standard factor) / Total Hours Worked |
Respiratory Condition |
|
Poisoning Cases Rate |
(Column M4 X standard factor) / Total Hours Worked |
Poisoning |
|
Hearing Cases Rate |
(Column M5 X standard factor) / Total Hours Worked |
Hearing |
|
All Other Illness Cases Rate |
(Column M6 X standard factor) / Total Hours Worked |
All Other Illness |